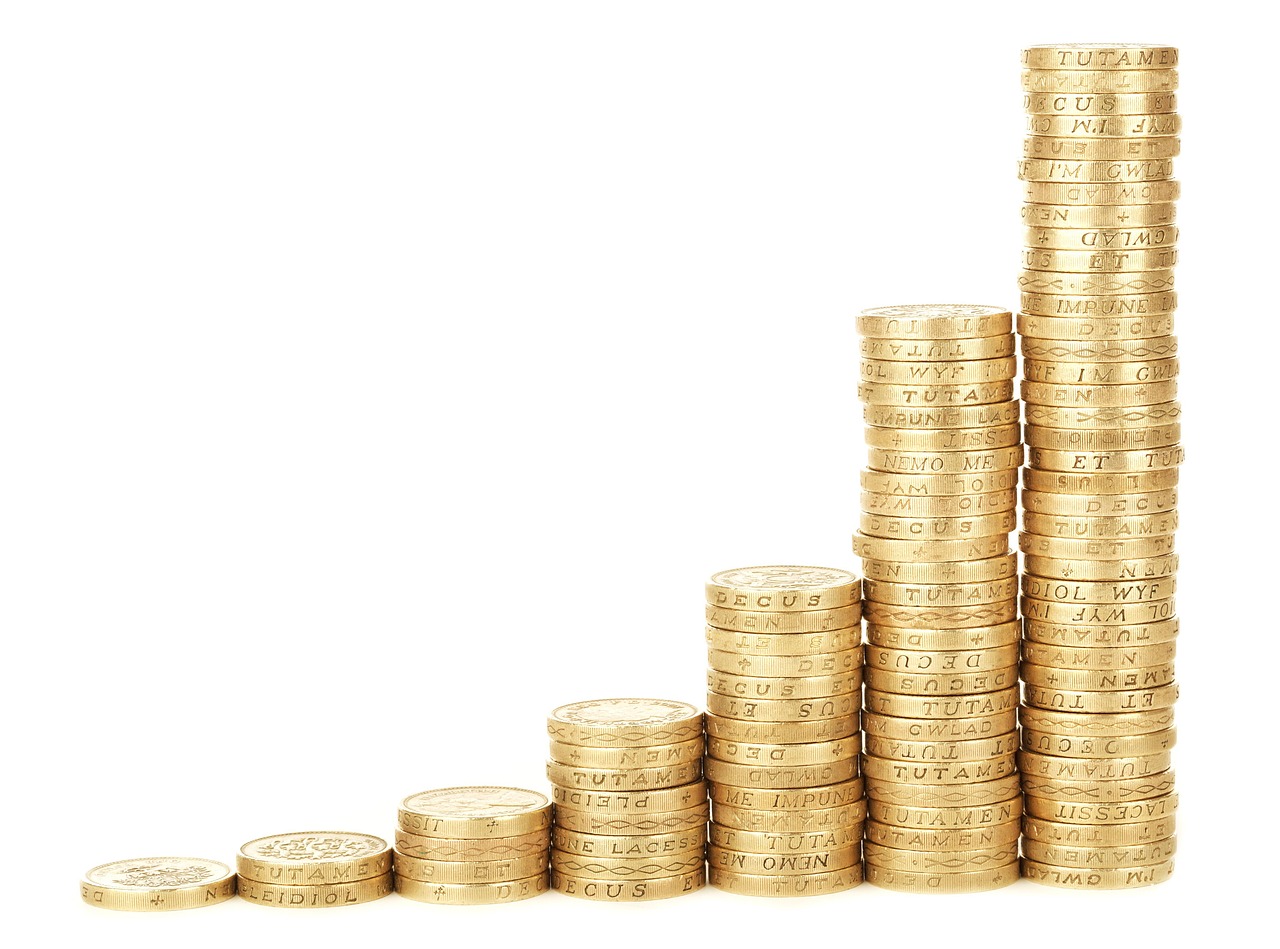
You’ll hear the term “compounding interest” a lot when you invest in the stock markets.
It’s a little different than what I usually do, but I thought it was important to talk about compound interest. I will not go into great detail, but instead focus on the numbers and visuals.
Google Sheets has some charts and tables that I created to help you better understand compound interest.
This post needs this. I am not a math wizard, data analyst, or spreadsheet master.
Here’s what you can expect to find:
Table of Contents
What is compound interest?
Compound Interest Examples Visualized
Investing $100 Every Year
Investing $1,000 Every Year
Investing $10,000 Every Year
Maximizing Your IRA
Maximizing Your Company 401k
Final Thoughts
What is compound interest?
There are many articles on compound interest. I have mentioned this in the introduction. So, I will not spend much time explaining it here.
A simple definition with context would be ideal.
Compound interest is the sum of the interest accrued on the principal plus any interest already accrued.
This is how the math formula looks (I hate math)
Visual examples of annual investments: The power of compound interest
Via Investopedia
What? This math equation is confusing and the definition of this equation is unclear. ?
It is much easier to break it down into small numbers. Here is the math using small numbers.
After the first year, you now have $101 ($100.01 = $1, $1 + $100 = $101). After the first year, you have $101 ($100.01= $1, $1 plus $100 = $101).
If you didn’t contribute anything in the second, you can add 1% to your $101. After year two, your balance is now $102.01.
The theme that is often heard from new investors and those who are trying to save money for retirement or just as a way to start saving up for their future is:
How will I be able retire when my income reaches six figures or more?
Compound interest is the answer.
Visualize compound interest examples
It can be intimidating to begin with, but the example of a basic number breakdown should help.
However, I wanted to go into more detail and show how compound interest can be your best friend.
This assumes that the following is true for all scenarios below:
I chose to be conservative and choose 7%.
They do not take into account inflation or fluctuations in stock prices.
It does not include any fees for withdrawals or investments.
These examples of compound interest are only to give a rough idea about some compound interest figures.
This formula was also found in an old Reddit post. I changed it to suit my style and the content I wanted to present.
Investing $100 Every Year
In 20 years, if you invest $100 every year and get an average return of 7%, you will have $4,387. In 40 years, you would have more than $21,000.
Visual examples of annual investments: The power of compound interest
Visual examples of annual investments: The power of compound interest
Investing $1,000 Every Year
In 20 years, if you invest $1,000 each year and get an average return of 7%, you will have $43,865. In 40 years, you would have more than $213,000!
Visual examples of annual investments: The power of compound interest
Visual examples of annual investments: The power of compound interest
Investing $10,000 Every Year
In 20 years, if you invest $10,000 each year and get an average return of 7%, you will have $438.652. You’ll have more than $2,000,000 in 40 years!
Note: If you increase your contribution by 1% each year, you would have $472.493 in 20 years (a difference of $33,841). In 40 years, you would have $2,404.931 ($304,931 difference).
Visual examples of annual investments: The power of compound interest
Visual examples of annual investments: The power of compound interest
Maximizing Your IRA
This number is generally adjusted to inflation. The maximum contributions are subject to change, as they were previously $5.500.
To keep things simple, let’s assume that you add $6,000 per year. If you invest $6,000 each year and get a 7% rate of return, you will have $263,191 in 20 years. In 40 years, you would have more than $1,280,000.
The Power of Compound interest: Visual examples of annual investments
Visual examples of annual investments: The power of compound interest
Maximizing Your Company 401k
You’ll do well if you have a 401k plan through your company and you can max it each year. This data does NOT account for inflation or company matching.
If you contributed $19,000 (the latest contribution number at the time of publication) and received an average return of 7%, you would have $833.438 in 20 years. In 40 years you will have more than $4,000,000.
Visual examples of annual investments: The power of compound interest
Visual examples of annual investments: The power of compound interest
Final Thoughts
The more you save the greater the compound interest you earn.
Imagine what you could have for retirement in 20+years if you invested the maximum in an IRA. Another reason to invest as soon as possible.
The above data does NOT include inflation, withdrawal fees or any investment fees. However, it should help you to see the big picture.
You may not be able to save as much as you would like, you might have a few years where you don’t need to save, or perhaps you contribute to your 401k at the maximum.
Doing something is always better than doing nothing.
Compound interest can be a real game changer. You can start with a small contribution of $100 or $1,000 and increase it by X% per year.


